This article describes how to view analytics for all of your Recommend tracks.
Navigate to Analytics for All Recommend Tracks
- Click on Recommend in the menu bar.
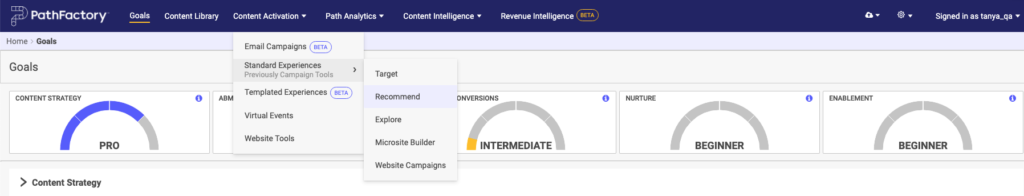
Recommend menu item
- You are now on the Recommend Track page, which shows all of your Recommend Tracks.
- Without selecting an individual track, click Recommend Analytics.
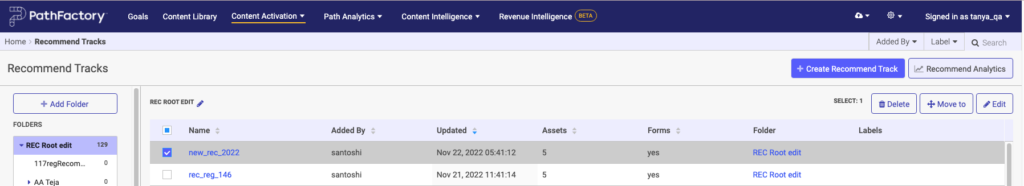
Recommend Analytics button
- You are now on the analytics page for all Recommend Tracks.
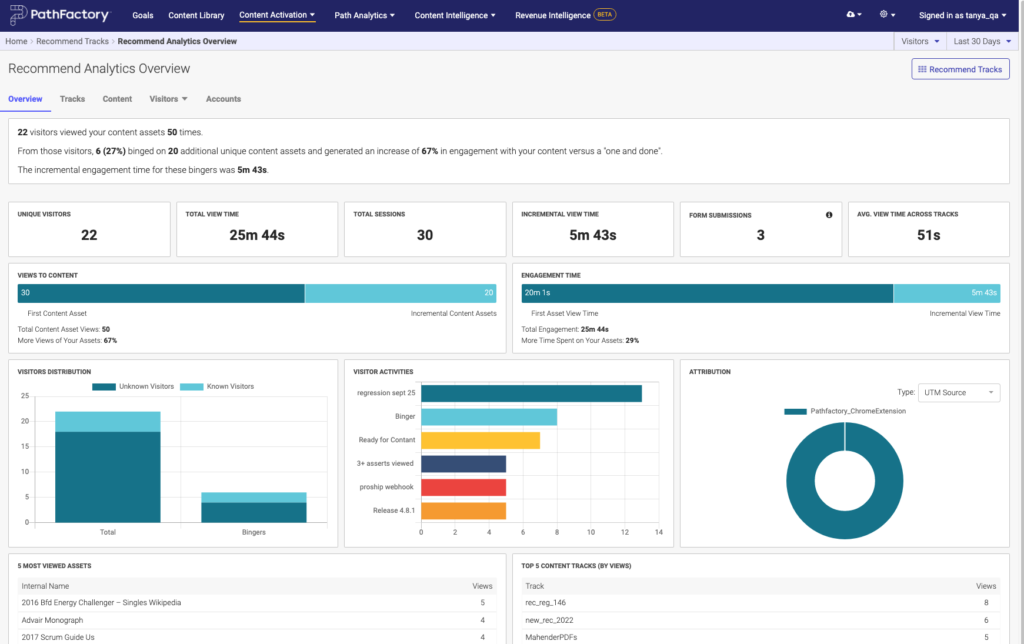
Recommend Analytics overview - For definitions of the Analytics fields see below.
Understanding Recommend Analytics: Multi-Track View
This article provides detailed definitions to help you understand the analytics of all Recommend Tracks you’ve created. If you want definitions to understand the analytics from a single Recommend Track, click here.
Overview Tab
The Recommend Analytics Dashboard gives you an overview of how all your recommend experiences are performing.
- Headline – Provides a high level summary of how all your Recommend Tracks are performing. Includes information on total unique visitors, total asset views, average binge rate, increase from single asset views to multiple asset views, and the total amount of time visitors viewed additional assets beyond the first.
- Unique Visitors – Total number of unique visitors that have engaged with any of your Recommend Content Tracks.
- Total View Time – This is the total amount of time your audience has spent engaging with your Recommend Content Tracks.
- Total Sessions – Total number of times your Recommend Content Tracks have been visited.
- Incremental View Time – Total amount of time your audience spent viewing assets beyond the first asset in a Recommend Content Track.
- Form Submissions – Total number of PathFactory standard forms submitted by visitors while engaging with your Recommend Tracks. If you are using PathFactory’s Capture Tag, this number will be the total number of PathFactory standard forms as well as external and custom forms.
- Average View Time Across Tracks – Average amount of time that each visitor spent within any of your Recommend Content Tracks.
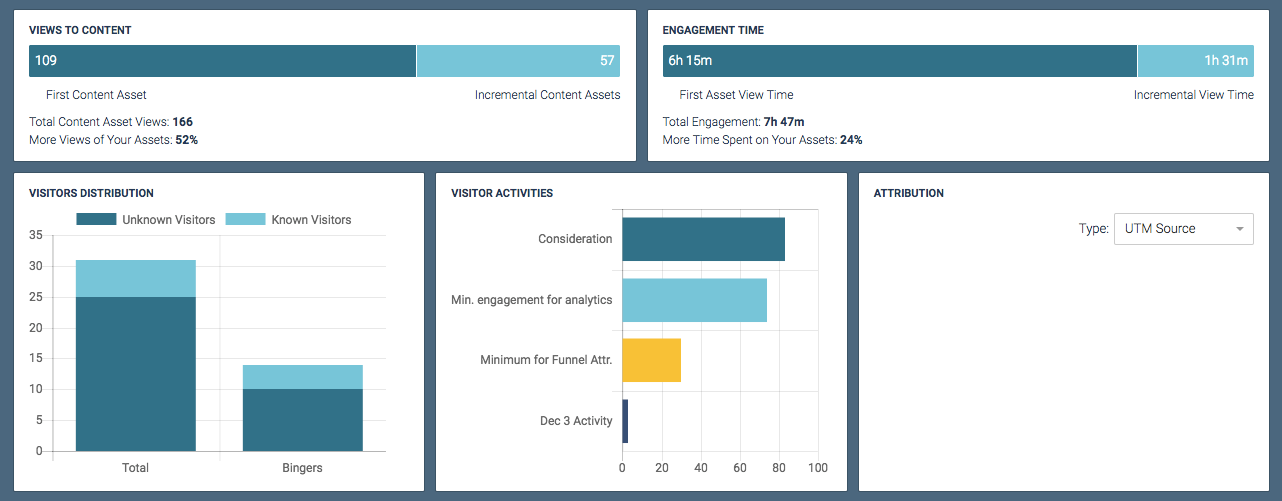
- Views to Content
- First Content Asset: Total number of times the first asset in a Recommend Content Track was viewed.
- Incremental Content Assets: Total number of additional content assets viewed beyond the first asset in all of your Recommend Content Tracks..
- Total Content Asset Views: Total number of times any content asset was viewed in all of your Recommend Content Tracks.
- More Views of Your Assets: Percentage of content viewed beyond the first asset, calculated by dividing Incremental Content Assets by the First Content Assets in a session.
- Engagement Time
- First Asset View Time – Total time your visitors spent viewing the first asset in any of your Recommend Tracks.
- Incremental View Time – Total time your visitors spent viewing any assets beyond the first in any of your Recommend Tracks.
- Total Engagement – Total time your visitors spent viewing your Recommend Tracks.
- More Time Spent on Your Assets – Percentage of additional time your visitors spent viewing content assets beyond the first asset, calculated by dividing Incremental View Time by First Asset View Time.
- Visitors Distribution – Chart showing the total known and unknown visitors, and known and unknown bingers.
- Visitor Activities Chart – Chart showing up to the top 8 Visitor Activities whose conditions were met from all your Recommend Tracks during the specified time period.
- Attribution – If you have been using UTM parameters in your Recommend Track URLs, this section will display where your traffic is coming from, and is sortable by the various UTM parameters (ie. Source, Content, Campaign, Term, Medium).
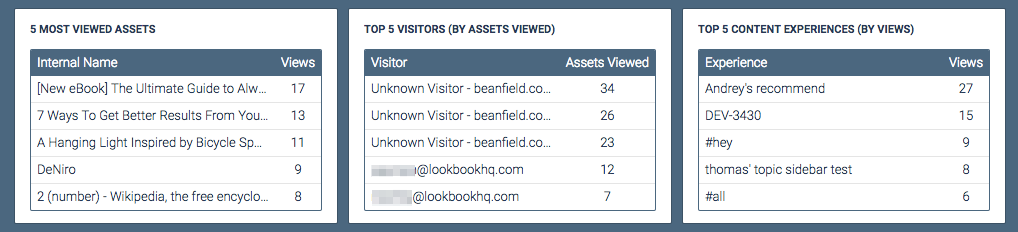
- 5 Most Viewed Assets – Based on aggregated views, this shows you the top 5 viewed assets throughout all your Recommend Content Tracks.
- Top 5 Visitors – Based on assets viewed by visitors, this shows you your top 5 engaged visitors across all your Recommend Content Tracks.
- Top 5 Tracks – Based on total views per experience, this shows the top 5 Recommend Content Tracks that you currently have.
Filters
You are able to filter the Overview Analytics according to the following:
- Only Known Visitors – Selecting this filter will cause only analytics from Known visitors to be displayed.
- Show Excluded Visitors – Selecting this filter will cause visitors from white-listed email addresses and IP addresses to be included in the analytics.
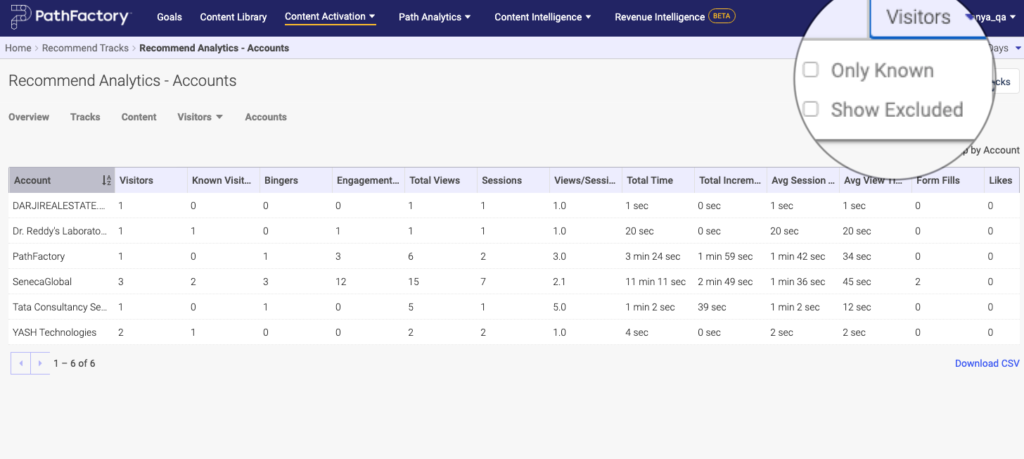
Visitor filters - Date Range – You are able to set the date range to display only data from the specified time. Preset values of Past 7, 30, or 60 days are available, but you can also set your own custom timeframe.
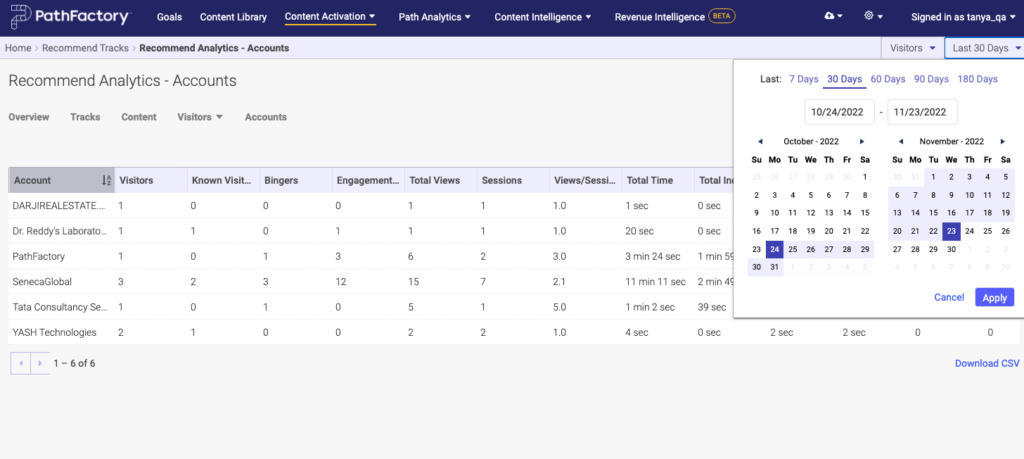
Date range filter
Tracks tab
The Tracks tab provides detailed information on how your Recommend tracks are performing.
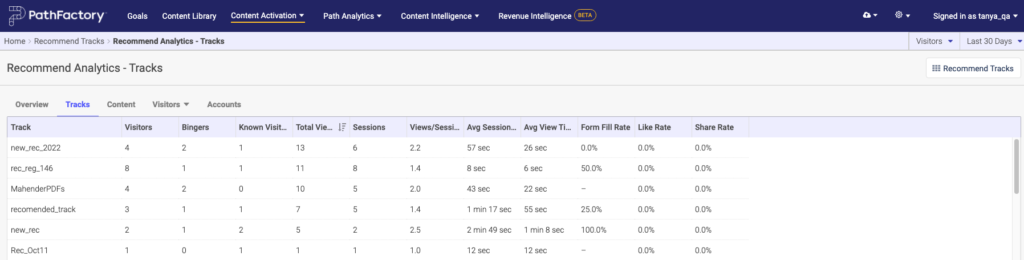
- Track – Here you see the slug for each track.
- Visitors – The number of individuals viewing your content tracks.
- Bingers – The number of individuals who have consumed 2 or more content assets during any given session while viewing the content tracks.
- Known Visitors – Total number of unique visitors who have an email address associated with them who have viewed the content tracks.
- Total Views – Total number of times the content has been viewed, by known and unknown visitors.
- Sessions – Total number of viewing sessions that have occurred with this track.
- Views/Session – The number of content asset views per session.
- Avg Session Time – Average number of content asset views per session. This is calculated by dividing the total number of views by the total number of sessions.
- Avg View Time – Average amount of time a visitor has spent with content assets.
- Form Fill Rate – The percentage of how often a visitor filled in a form to view a content asset.
- Like Rate – The percentage of how often content asset were liked after being promoted to a visitor.
- Share Rate – The percentage of how often content asset were shared after being promoted to a visitor.
Content tab
The Content tab provides a table detailing engagement with specific content assets.
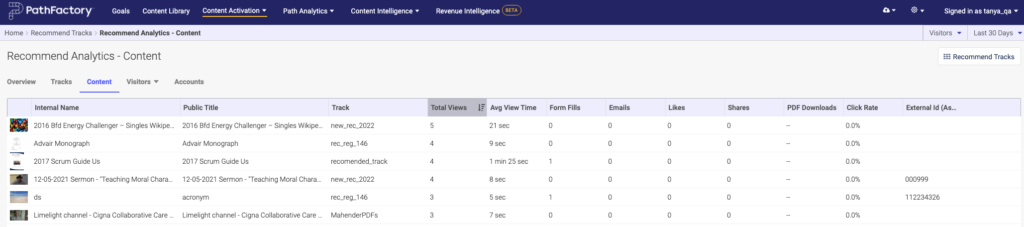
- Internal Name – The name given to a content asset that is only visible within your PathFactory instance, and is not visible to the public.
- Public Title – The public-facing title of a content asset.
- Track – Here you see the slug for each track.
- Total Views – The total number of times a content asset was viewed in all Recommend tracks.
- Average View Time – This is the average amount of time that visitors spent on content assets in the Recommend tracks.
- Form Fills – The total number of times a visitor filled in a form for content assets.
- Emails – The total number of emails sent sharing content assets for all of the Recommend tracks.
- Likes – The total number of likes each content asset generated for all of the Recommend tracks.
- Shares – The total number of times each content asset was shared for all of the Recommend tracks.
- PDF Downloads – The total number of times a visitor downloaded a PDF version of all of the Recommend tracks
- Click Rate – The percentage of how often content assets were clicked on after being promoted to a visitor. This number is calculated by dividing the total number of clicks from visitors selecting that content asset by the total number of impressions (an impression is counted as every time a content asset was shown to a visitor in a promoter).
- External ID (Asset) – If you added an External ID to the assets for these tracks, you see that ID in this column.
Visitors tab
The Visitors tab provides multiple configurations to view visitor data.
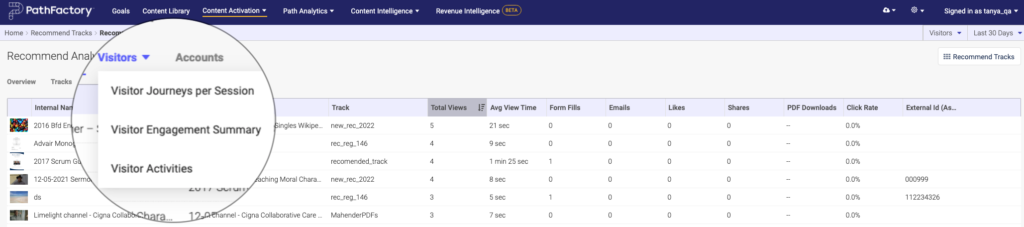
Visitor Journeys per Session
Visitor Journeys per Session presents visitor data for each session. The number of rows in this table reflects the number of sessions for the Recommend track. Additional configuration is available, as you can choose to view details of the session, details of the visitors, or UTM parameters.
Select the arrow to the left of a visitor ID to see a visual representation of the visitors journey during their session. Select Show All Visitor Journeys in the top right for this view of every session.
All Visitor Journeys per Session tables have two CSV options available to download.
- Sessions – Provides session-based information such as total assets viewed during a given session, and total and average session durations.
- Asset Views – Provides content asset-based information such as time spent on all assets, and tags associated with the content assets.
Session Details
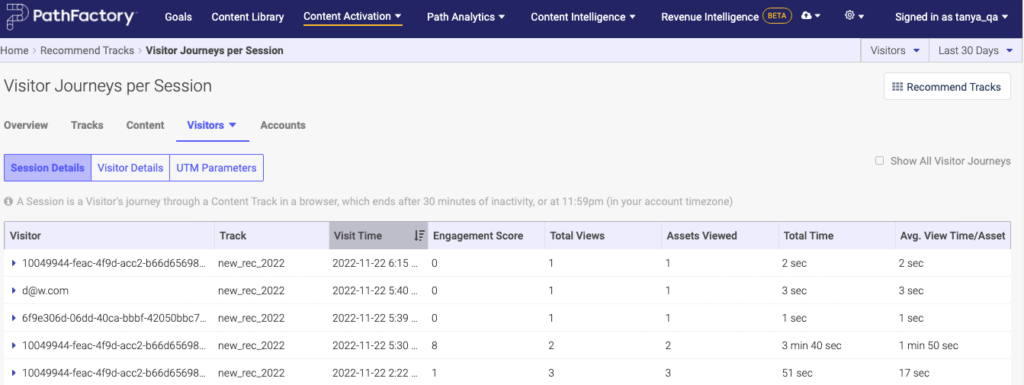
- Visitor – The individual who is viewing your content track. If the visitor has been identified this field will display their email address. If they are an anonymous visitor this field will display their unique ID. Using cookies, we are able to give the same ID to returning visitors, even though they are anonymous.
- Track – Here you see the slug for each track.
- Visit Time – The time and date stamp of the beginning of each session.
- Engagement Score – The engagement score achieved by the visitor in the given session. The engagement score is a number of points you give to visitors once they have interacted with a content asset in the way which you have already defined as significant. The engagement score on this table is the sum of points a visitor has achieved from the content assets they engaged with.
- Total Views – The total number of content assets the visitor viewed during the session. If the visitor viewed a particular content asset multiple times, each of those views will be counted here.
- Assets Viewed – The total number of unique content assets the visitor viewed during the session.
- Total Time – The total time the visitor spent in your content track.
- Average View Time per Asset – The average time the visitor spent on content assets during their session. Calculated by dividing the Total Time by the Assets Viewed.
Visitor Details
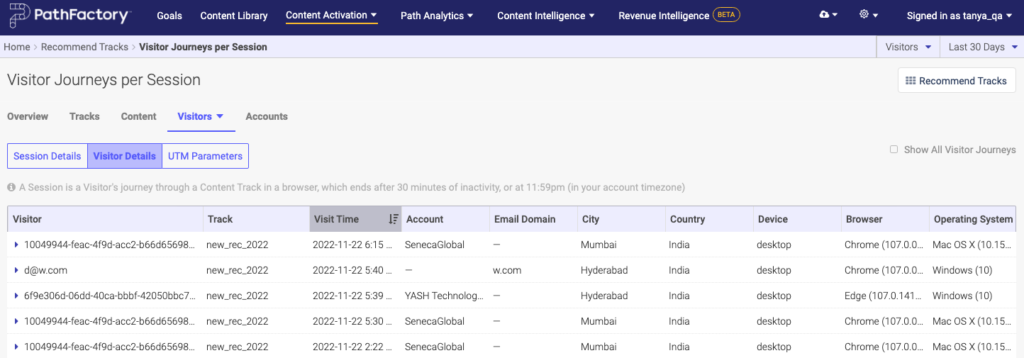
- Visitor – The individual who viewed the content track. If the visitor has been identified this field will display their email address. If they are an anonymous visitor this field will display their unique ID. Using cookies, we are able to give the same ID to a returning visitor, even though they are anonymous.
- Track – Here you see the slug for each track.
- Visit Time – The time and date stamp of the beginning of each session.
- Account – The name of the account from which the visitor accessed your content track.
- Email Domain – If the visitor has been identified this field will display the domain of that email address. For example, for the email abc@example.com this field would display “example.com”
- City – The city the visitor was in when they accessed the content track.
- Country – The country the visitor was in when they accessed the content track.
- Device – The type of device the visitor used to access the content track. Examples include desktop and mobile.
- Browser – The name and version of browser used to access the content track. Examples include Chrome, Firefox, and Safari.
- Operating System – The name and version of operating system used to access the content track. Examples include Mac, Windows, and Linux.
UTM Parameters
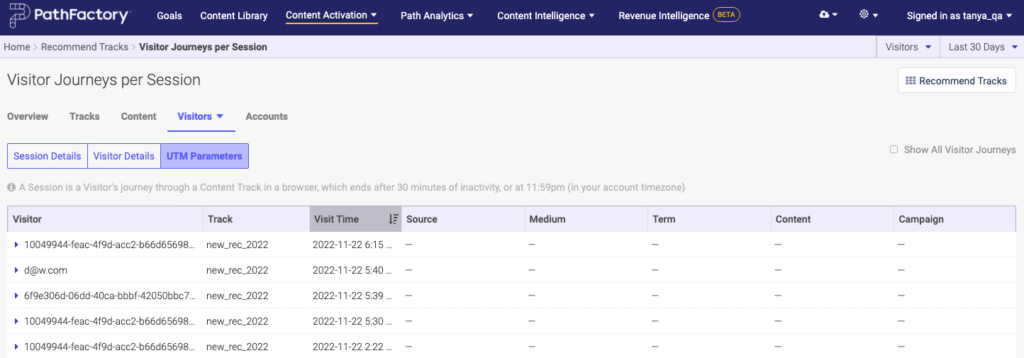
- Visitor – The individual who is viewing your content track. If the visitor has been identified this field will display their email address. If they are an anonymous visitor this field will display their unique ID. Using cookies, we are able to give the same ID to returning visitors, even though they are anonymous.
- Track – Here you see the slug for each track.
- Visit Time – The time and date stamp of the beginning of each session.
The following fields will only display values if you have set up UTM Parameters.
- Source – Captures the value provided in the UTM source parameter in the PathFactory content track URL.
- Medium – Captures the value provided in the UTM medium parameter in the PathFactory content track URL.
- Term – Captures the value provided in the UTM term parameter in the PathFactory content track URL.
- Content – Captures the value provided in the UTM content parameter in the PathFactory content track URL.
- Campaign – Captures the value provided in the UTM campaign parameter in the PathFactory content track URL.
Visitor Engagement Summary
The Visitor Engagement Summary sorts visitor data by individual visitors. The number of rows in the table reflects the number of unique visitors to the Recommend track.
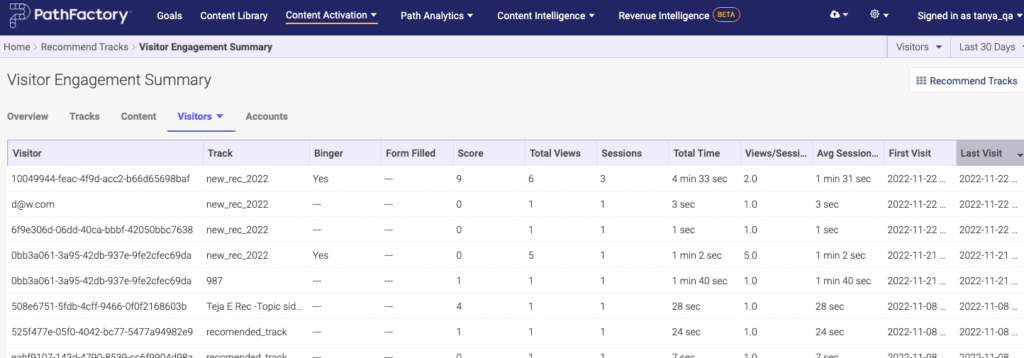
- Visitor – The individual who is viewing your content track. If the visitor has been identified this field will display their email address. If they are an anonymous visitor this field will display their unique ID. Using cookies, we are able to give the same ID to returning visitors, even though they are anonymous.
- Track – Here you see the slug for each track.
- Binger – If the visitor consumed 2 or more content assets during any given session while viewing the given content track this field will display “Yes.”
- Form Filled – If the visitor was identified during the given content track this field displays “Yes.”
- Score – The total engagement score earned by a visitor across all of their sessions.
- Total Views – The total number of content asset views by a visitor across all of their sessions. If the visitor viewed a specific content asset multiple times this will be reflected in this number.
- Sessions – Total number of sessions in the content track of a visitor.
- Total Time – The total time a visitor has spent in the content track across all of their sessions.
- Views/Session – The number of content asset views per session.
- Average Session Time – The average amount of time a visitor has spent viewing the content track across all sessions. This is calculated by dividing the total view time by the number of sessions.
- First Visit – The time and date stamp of the beginning of the visitor’s first session.
- Last Visit – The time and date stamp of the beginning of the visitor’s last session.
Visitor Activities
Table showing triggered visitor activities.
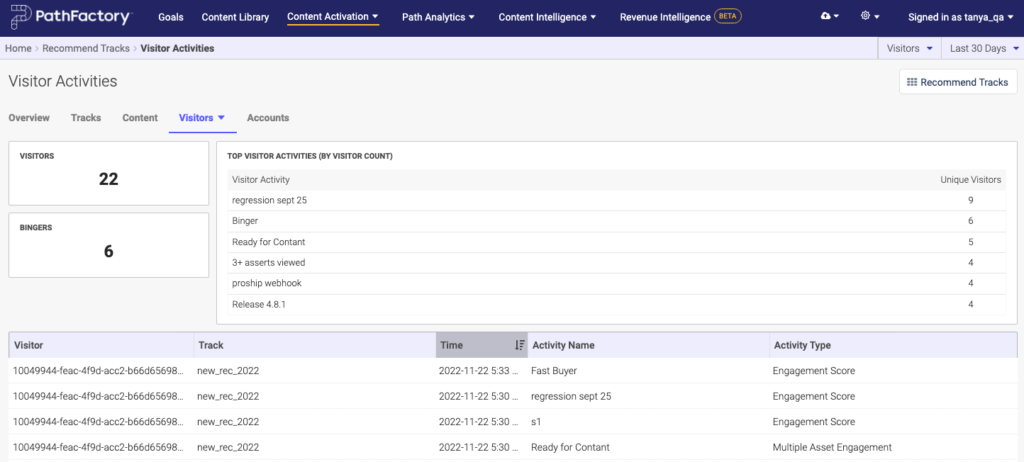
- Visitor – The individual who is viewing your content track. If the visitor has been identified this field will display their email address. If they are an anonymous visitor this field will display their unique ID. Using cookies, we are able to give the same ID to returning visitors, even though they are anonymous.
- Track – Here you see the slug for each track.
- Time – The time and date stamp of the visitor activity.
- Activity Name – The name given to the activity, as defined during the creation of that Visitor Activity.
- Activity Type – The type of Visitor Activity.
Accounts
The Accounts tab allows you to view engagement data according to the account which viewed your content track.
|
Note
|
This table is only visible to clients who have purchased the ABM Analytics upgrade. |
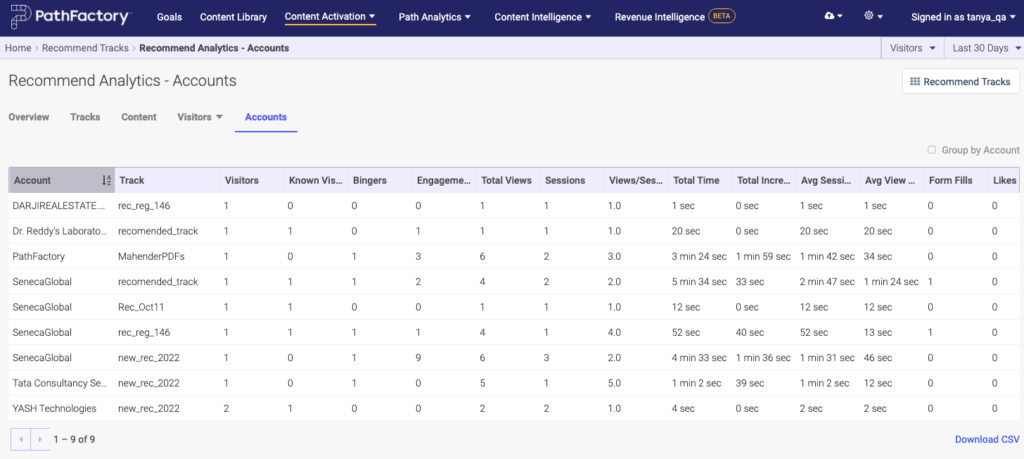
- Account – Account name from which individuals accessed your content track.
- Track –
- Visitors – Total number of unique visitors who viewed the given content track.
- Known Visitors – Total number of unique visitors who have an email address associated with them who have viewed the given content track.
- Bingers – Total number of visitors who consumed two or more content assets during any of their sessions for the given content track.
- Engagement Score – Total engagement score earned by visitors from a given account when interacting with the given content track.
- Total Views – Total number of content asset views by account-specific visitors across all of their sessions. If visitors viewed a specific content asset multiple times this will be reflected in this number.
- Sessions – Total number of times the given content track was visited by the specific account.
- Views/Session – Average number of content asset views per session. This is calculated by dividing the total number of views by the total number of sessions.
- Total Time – Total amount of time spent by all account-specific visitors in the given content track.
- Total Incremental Time – Total amount of time the account-specific visitors spent viewing assets beyond the first asset in the given content track.
- Average Session Time – The average amount of time a visitor has spent viewing a content track across all sessions. This is calculated by dividing the Total Time by the number of sessions.
- Average View Time – The average amount of time a visitor has spent viewing a content asset. This is calculated by dividing the Total Time by the Total Views.
- Form Fills – Number of times visitors from the given account were identified by submitting a form.
- Likes – Number of times visitors from the given account liked content assets.
- Shares – Number of times visitors from the given account shared content assets.
Click Group by Account to roll up your data according to accounts.