Overview
Path Analytics Reports provide a quick and flexible way to explore and share your PathFactory data. Powered by Looker, these reports allow you to filter your data to highlight only the most relevant data, helping you answer questions like “Which content types do our visitor prefer?”, “Which channels are driving the most content consumption?”, and more.
Check out the blog post for even more information on what questions your Path Analytics Reports can help you answer.
Where to find Reports
- Navigate to Path Analytics.
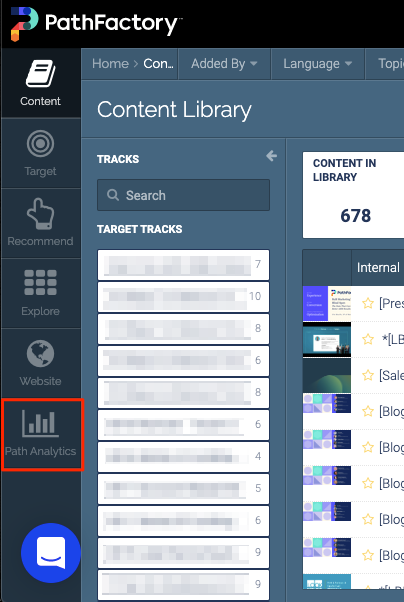 Path Analytics icon
 - Select the Reports tab.
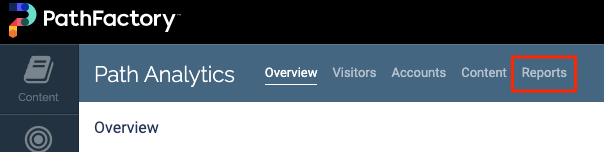 Path Analytics Reports
 - You can now choose one of the 7 available reports.
Note
See this article for more information on the data in these reports, and how they can be used. 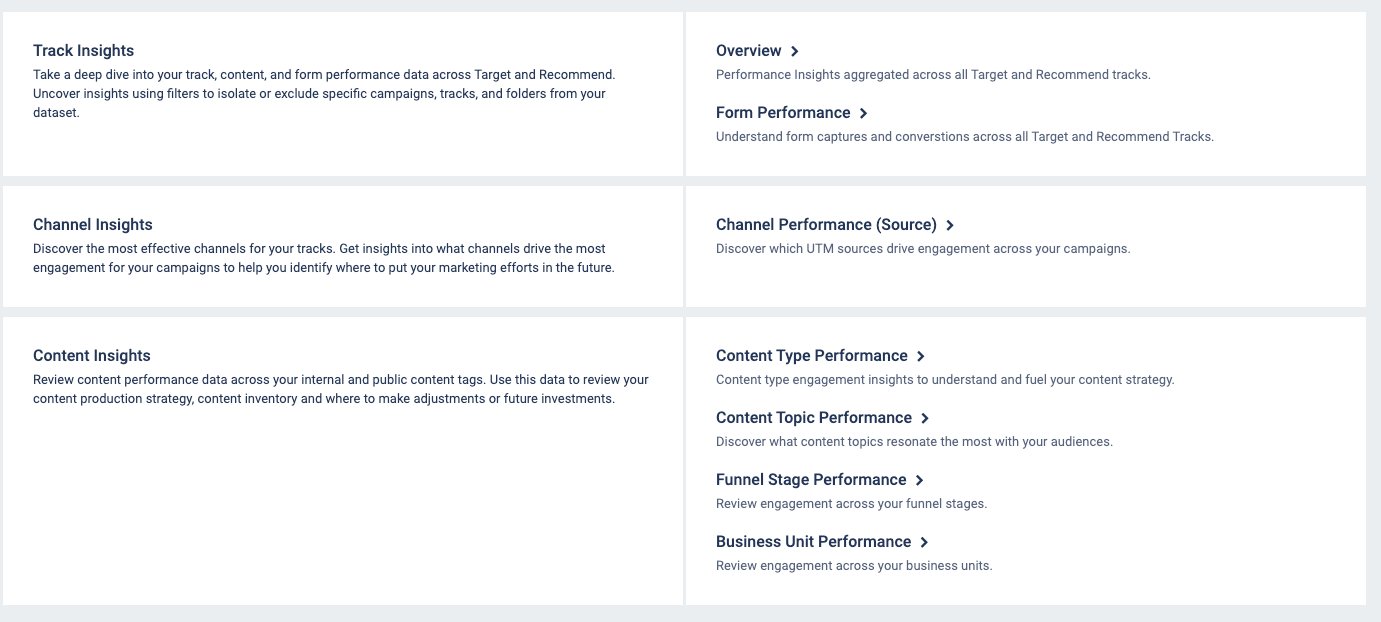
Reports
Filter your Reports
Use the filters to isolate or exclude specific items or ranges.
|
Note
|
Add additional filter conditions by clicking the plus sign beside the filter type you wish to add.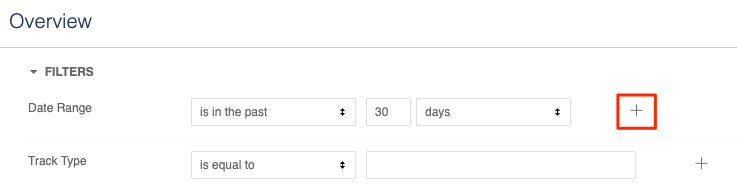 |
Date Range: Select or exclude specific date ranges
Track Type: Leave this field blank to show you all your Target and Recommend data. Indicate Target or Recommend to view more specific data
Track Name(s): Select or exclude multiple or single tracks from the data
Folder(s): Select or exclude multiple or single folders
Known = 1 or Unknown = 0: This filter applies binary logic – Type in 1 to surface known visitor data or type in 0 to surface unknown visitor data. By default this field is blank to show all visitor data
Sessions: Select or exclude session data. This is only available in the Channel Performance by Source report and can be used to exclude data that is less than desired from your UTM sources
Download your Reports
You are able to download either entire reports or individual data tiles.
Reports
Download an entire dashboard as complete CSV (which will contain the data across each tile and table) or as a PDF (this will show you the dashboard as is).
- Navigate to the report you want to download. Ensure that you have applied any necessary filters to the data, since you will download whatever data is displayed in the report.
- Click the gear icon, and select your file type using the drop-down menu.
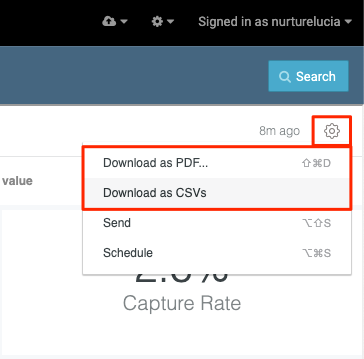 Download Options
Data Tiles
Download individual data tiles in any of the following formats: TXT (tab separated values), excel spreadsheet, CSV, JSON, HTML, or markdown.
- Navigate to the report you want to download. Ensure that you have applied any necessary filters to the data, since you will download whatever data is displayed in the tile.
- Hover over the tile you want to download, click the triple dot drop-down, and select Download Data.
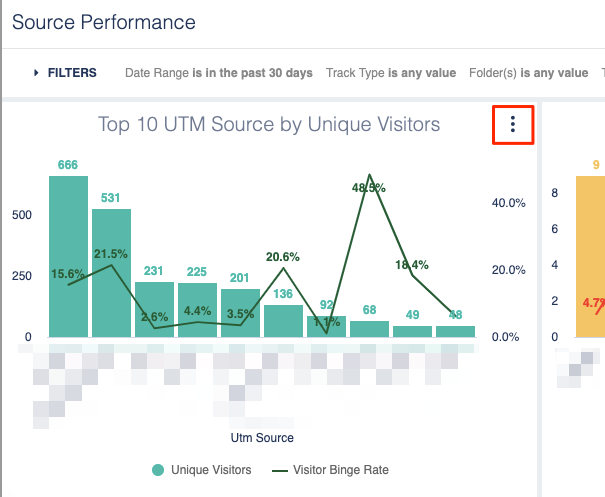 Example of Source Performance
|
Note
|
For more information on how to download your data, see this Looker article. |
Share your Reports
Get your data to where you need it to go using the send and schedule option available with our Path Analytics Reports powered by Looker.
Send
The Send option lets you send data once, directly from a Looker-powered Path Analytics Report.
|
Note
|
See this Looker documentation for more information. |
Schedule
Looker lets you schedule periodic email delivery of a Looker-powered Path Analytics Report. You can send the information via email, Amazon S3, or to an SFTP server.
- Navigate to the report you want to share.
- Click the gear icon, then select either Send or schedule from the drop-down menu.
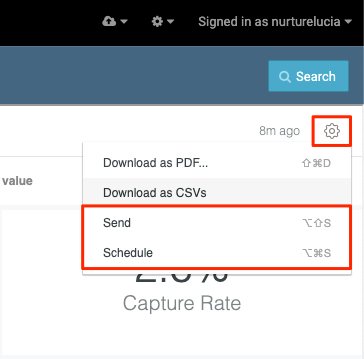 Send and Schedule Options